Correlation Analysis Excel Template
$9.00
Available in stock
Already have an account? Login
Add to cart| Available Formats | MS Excel |
|---|
Description
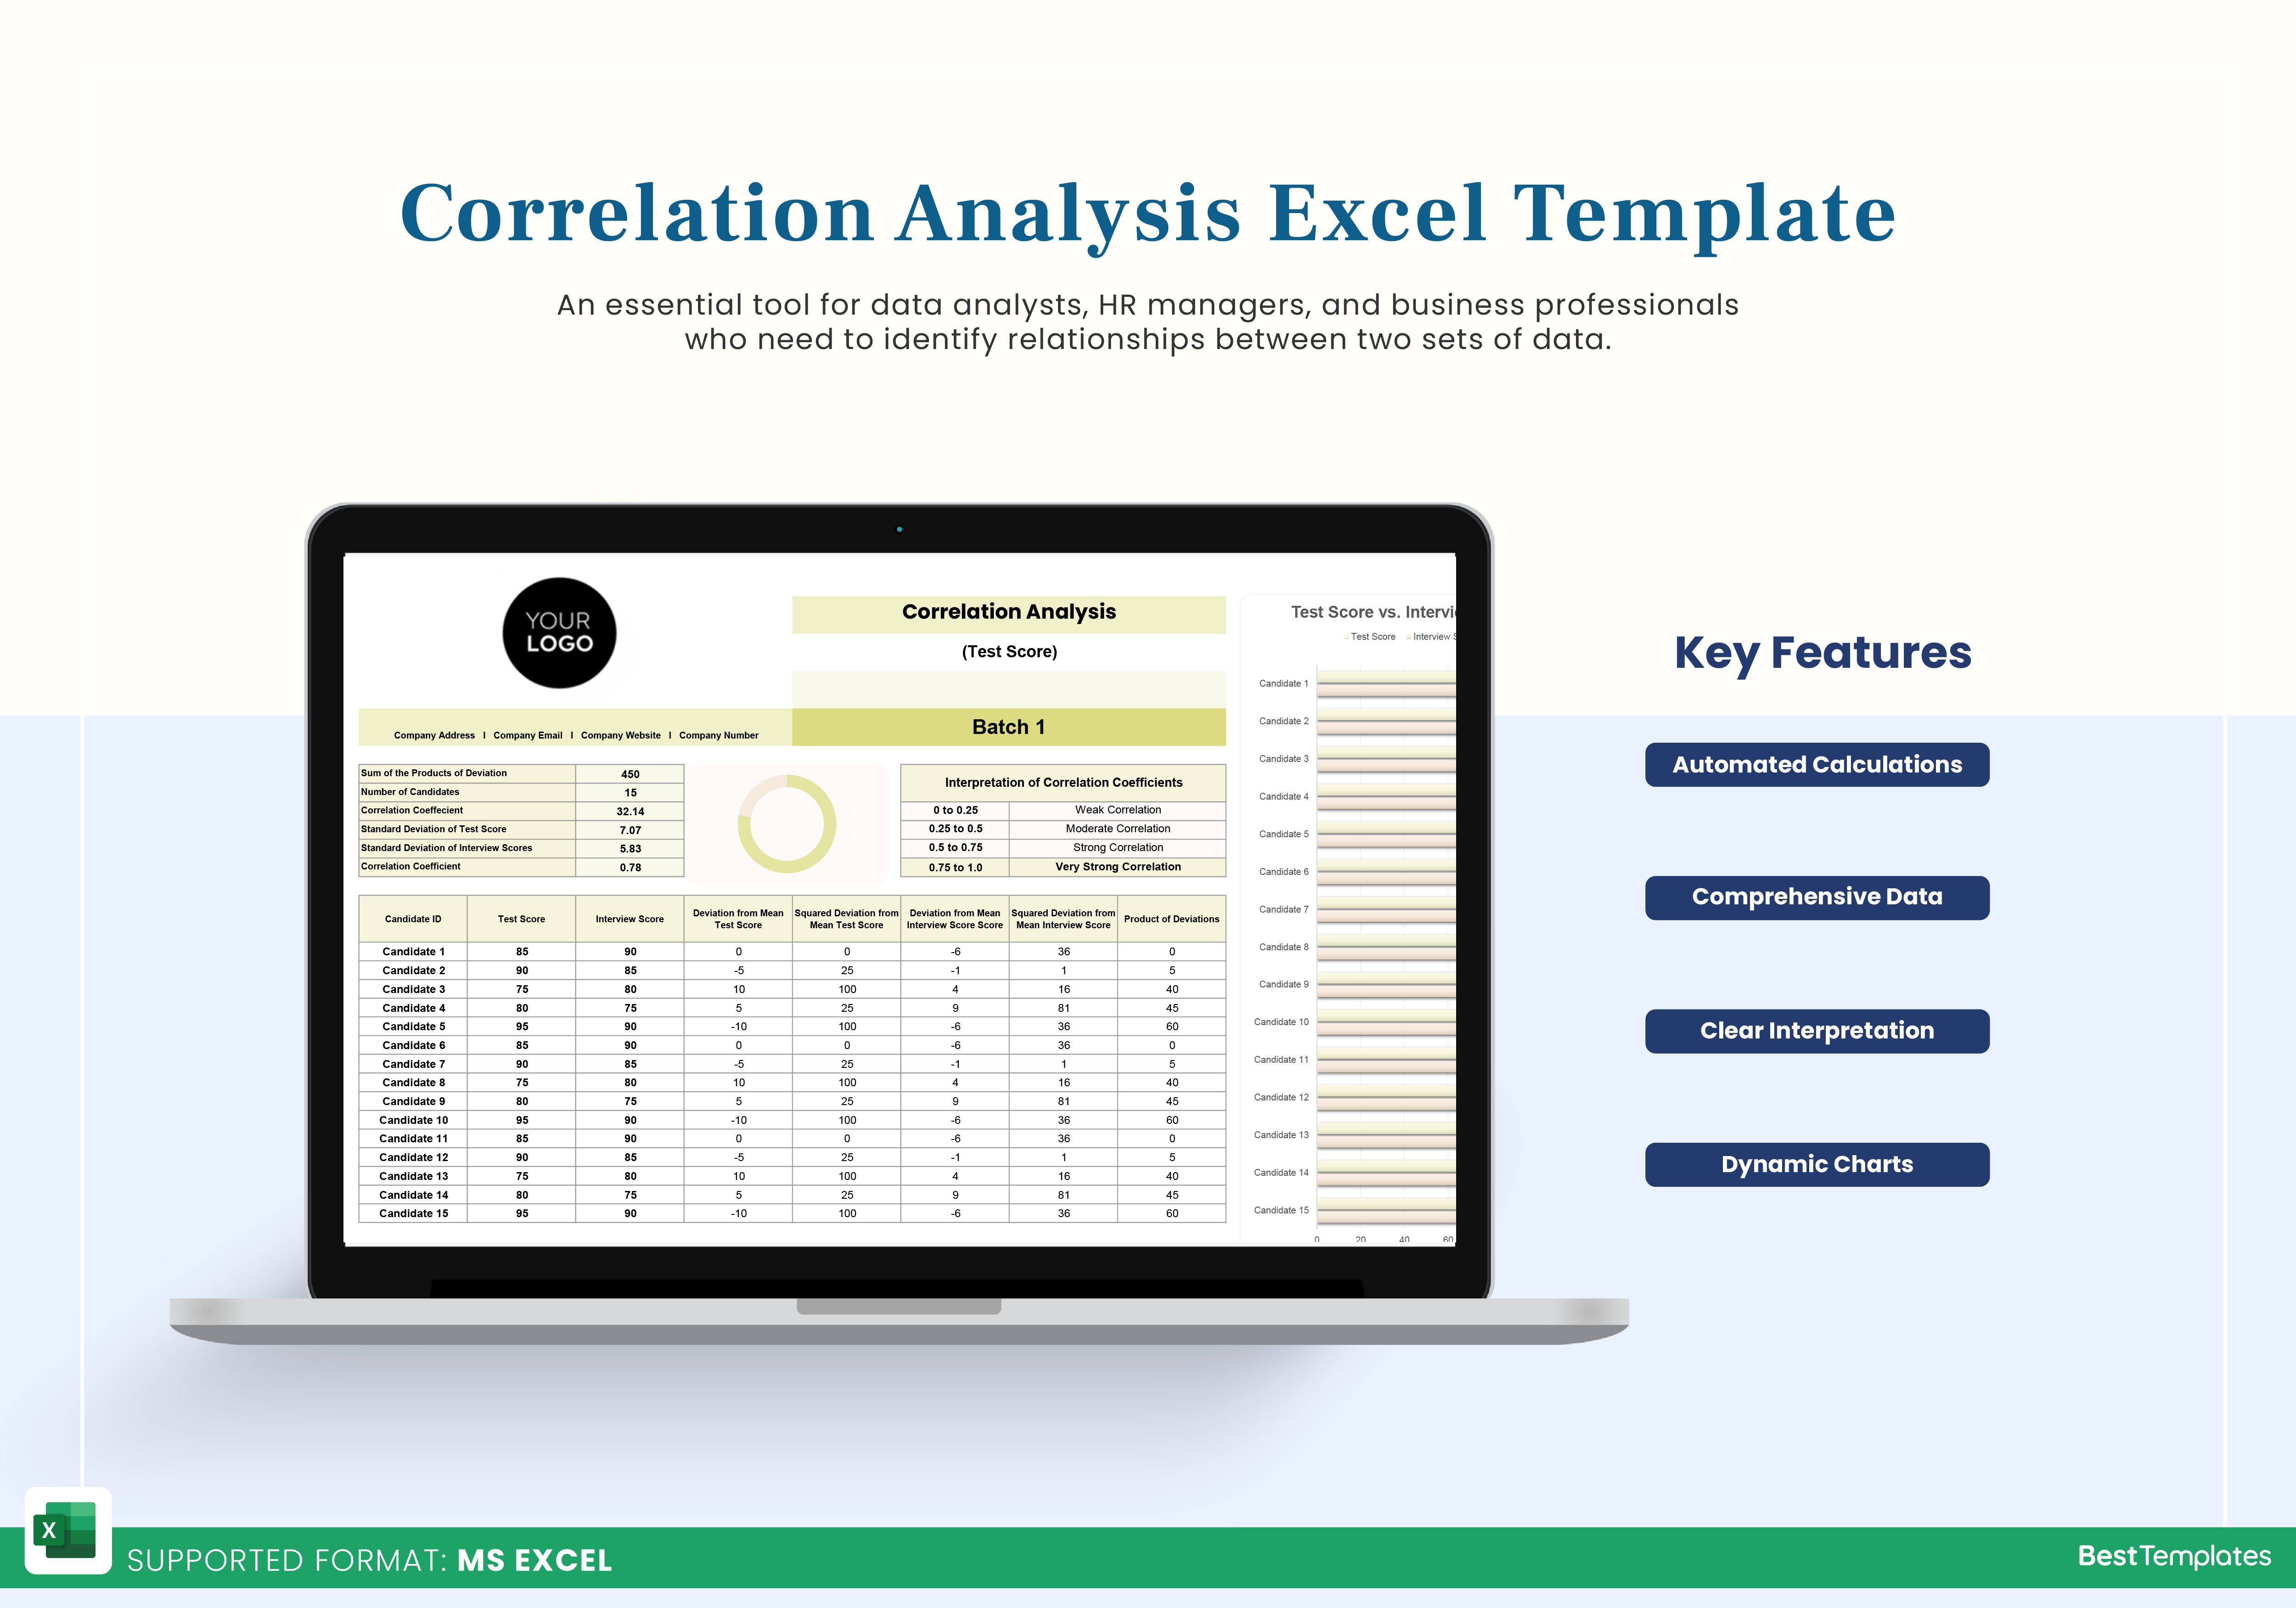
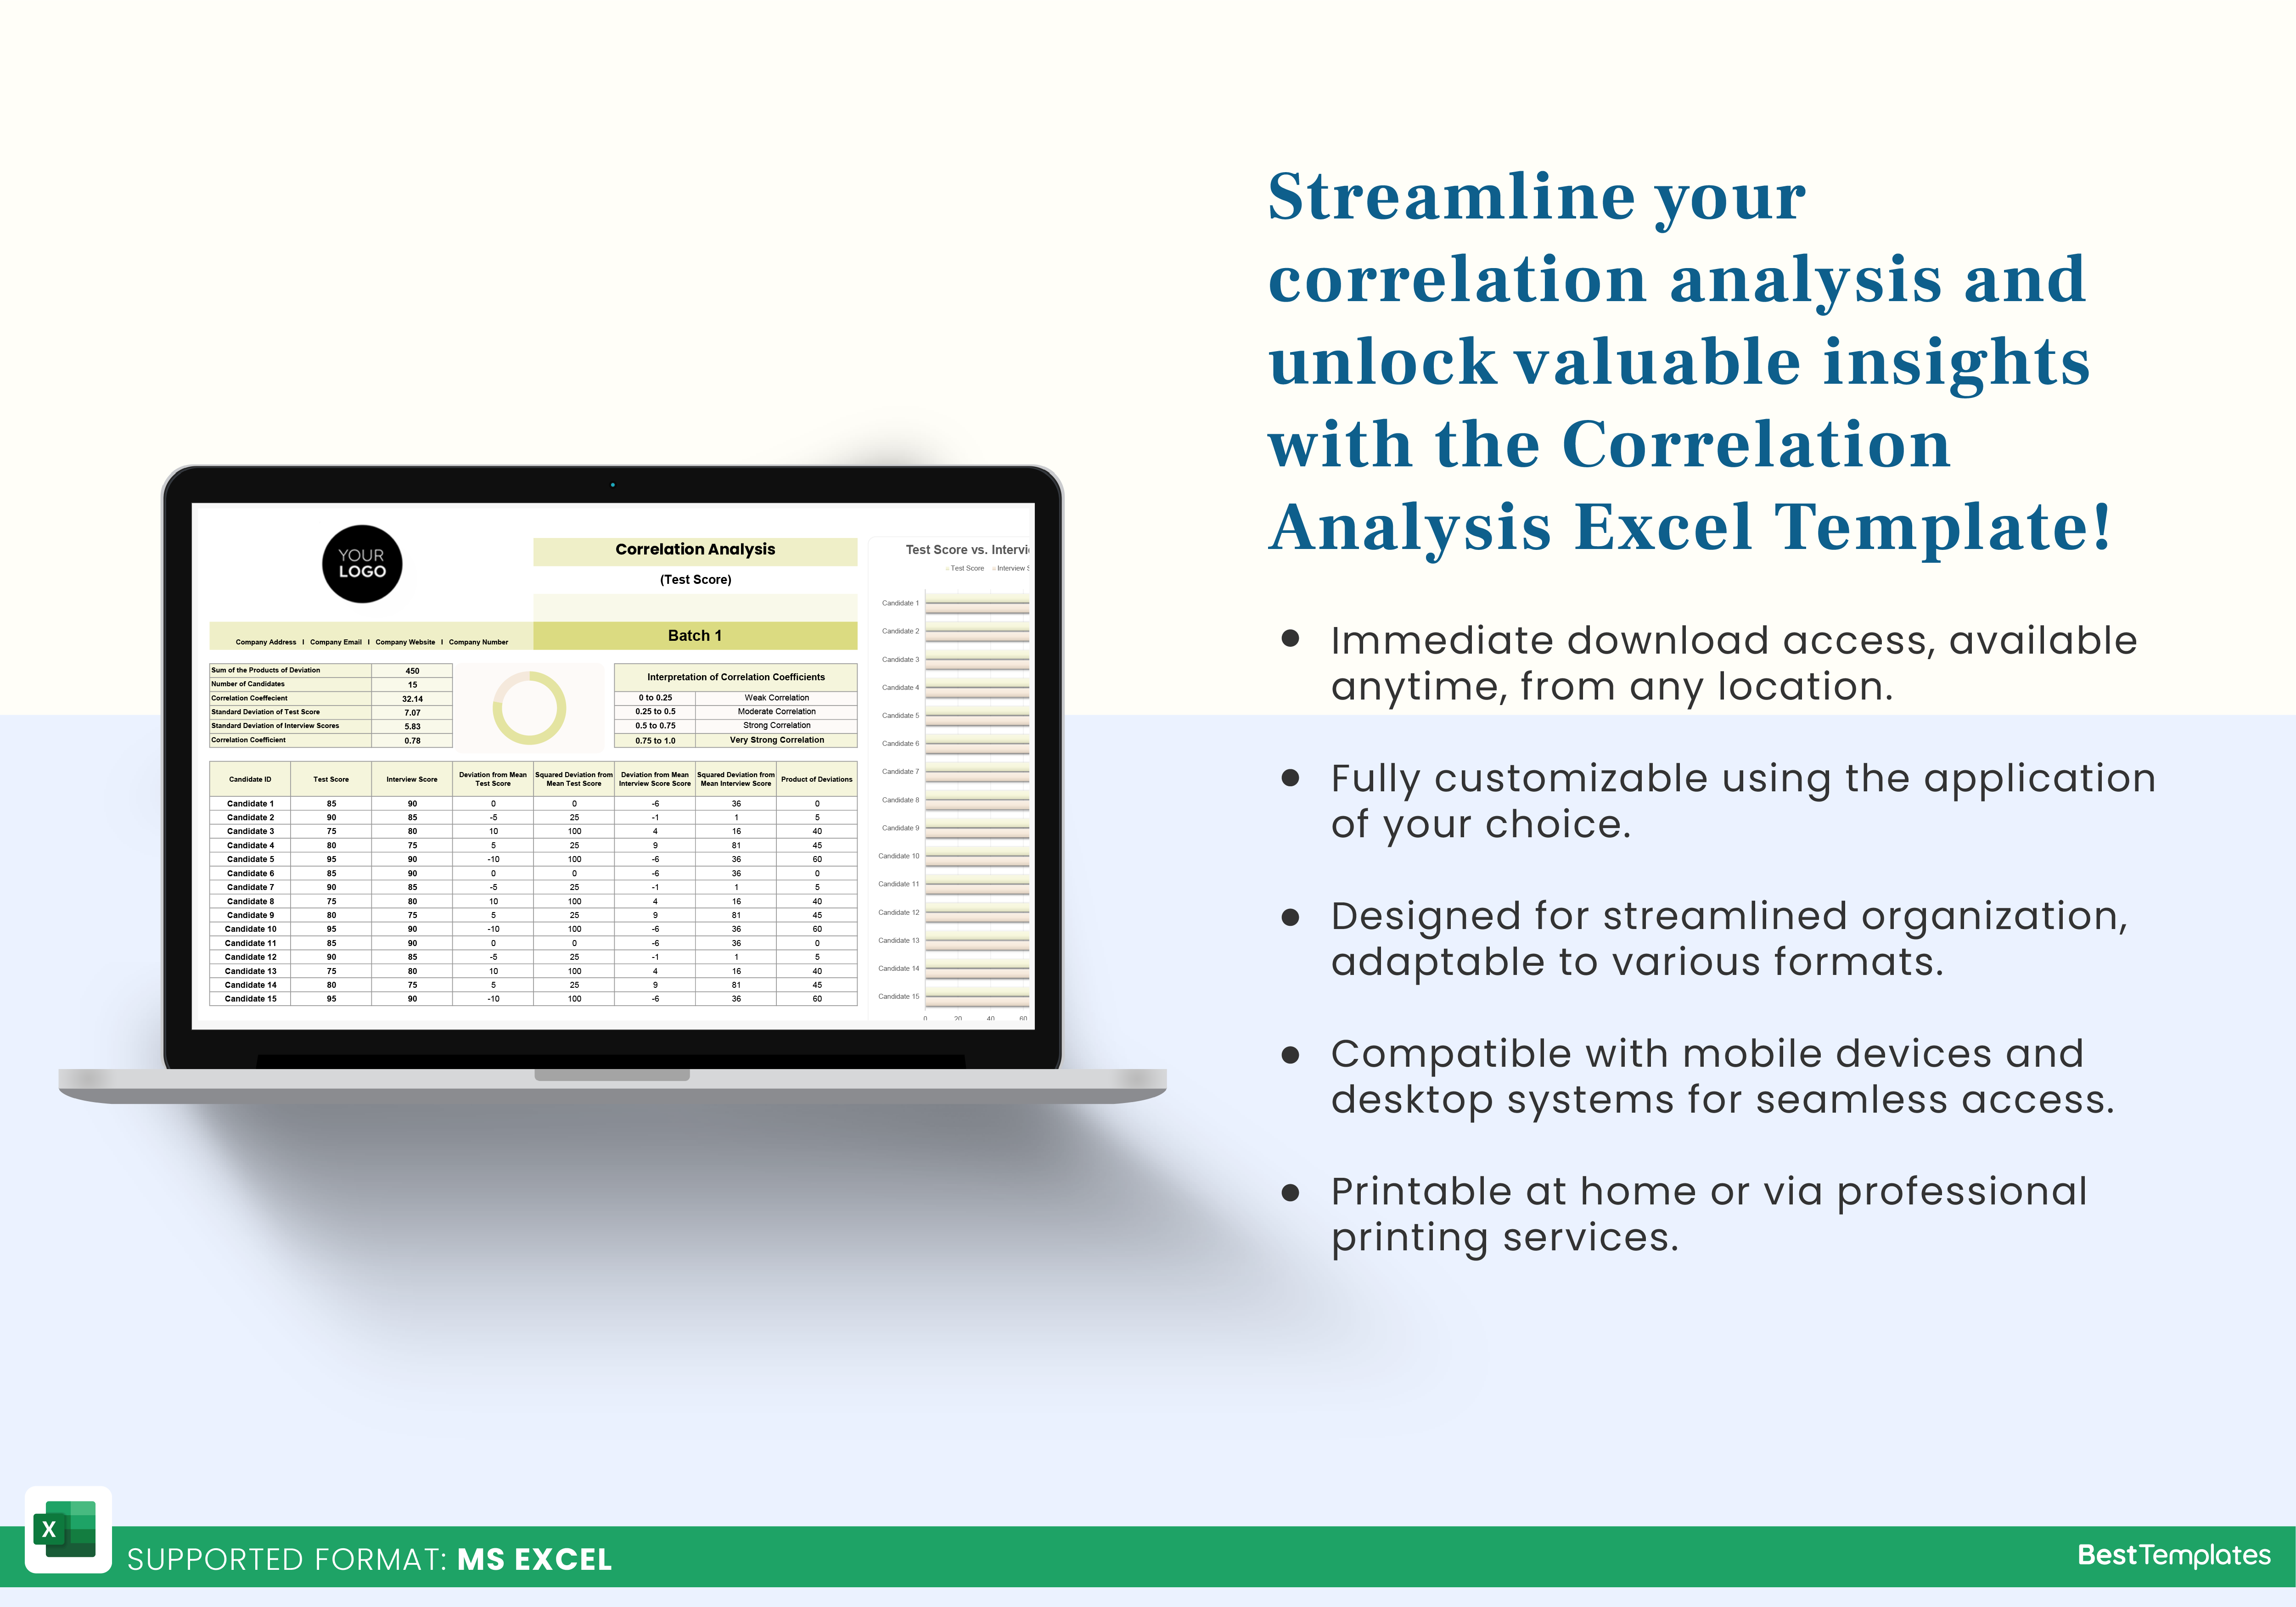
The Correlation Analysis Excel Template from Besttemplates.com is an essential tool for data analysts, HR managers, and business professionals who need to identify relationships between two sets of data. This versatile template allows you to assess the correlation between variables, such as test scores and interview scores, helping you make data-driven decisions quickly and efficiently.
Key features:
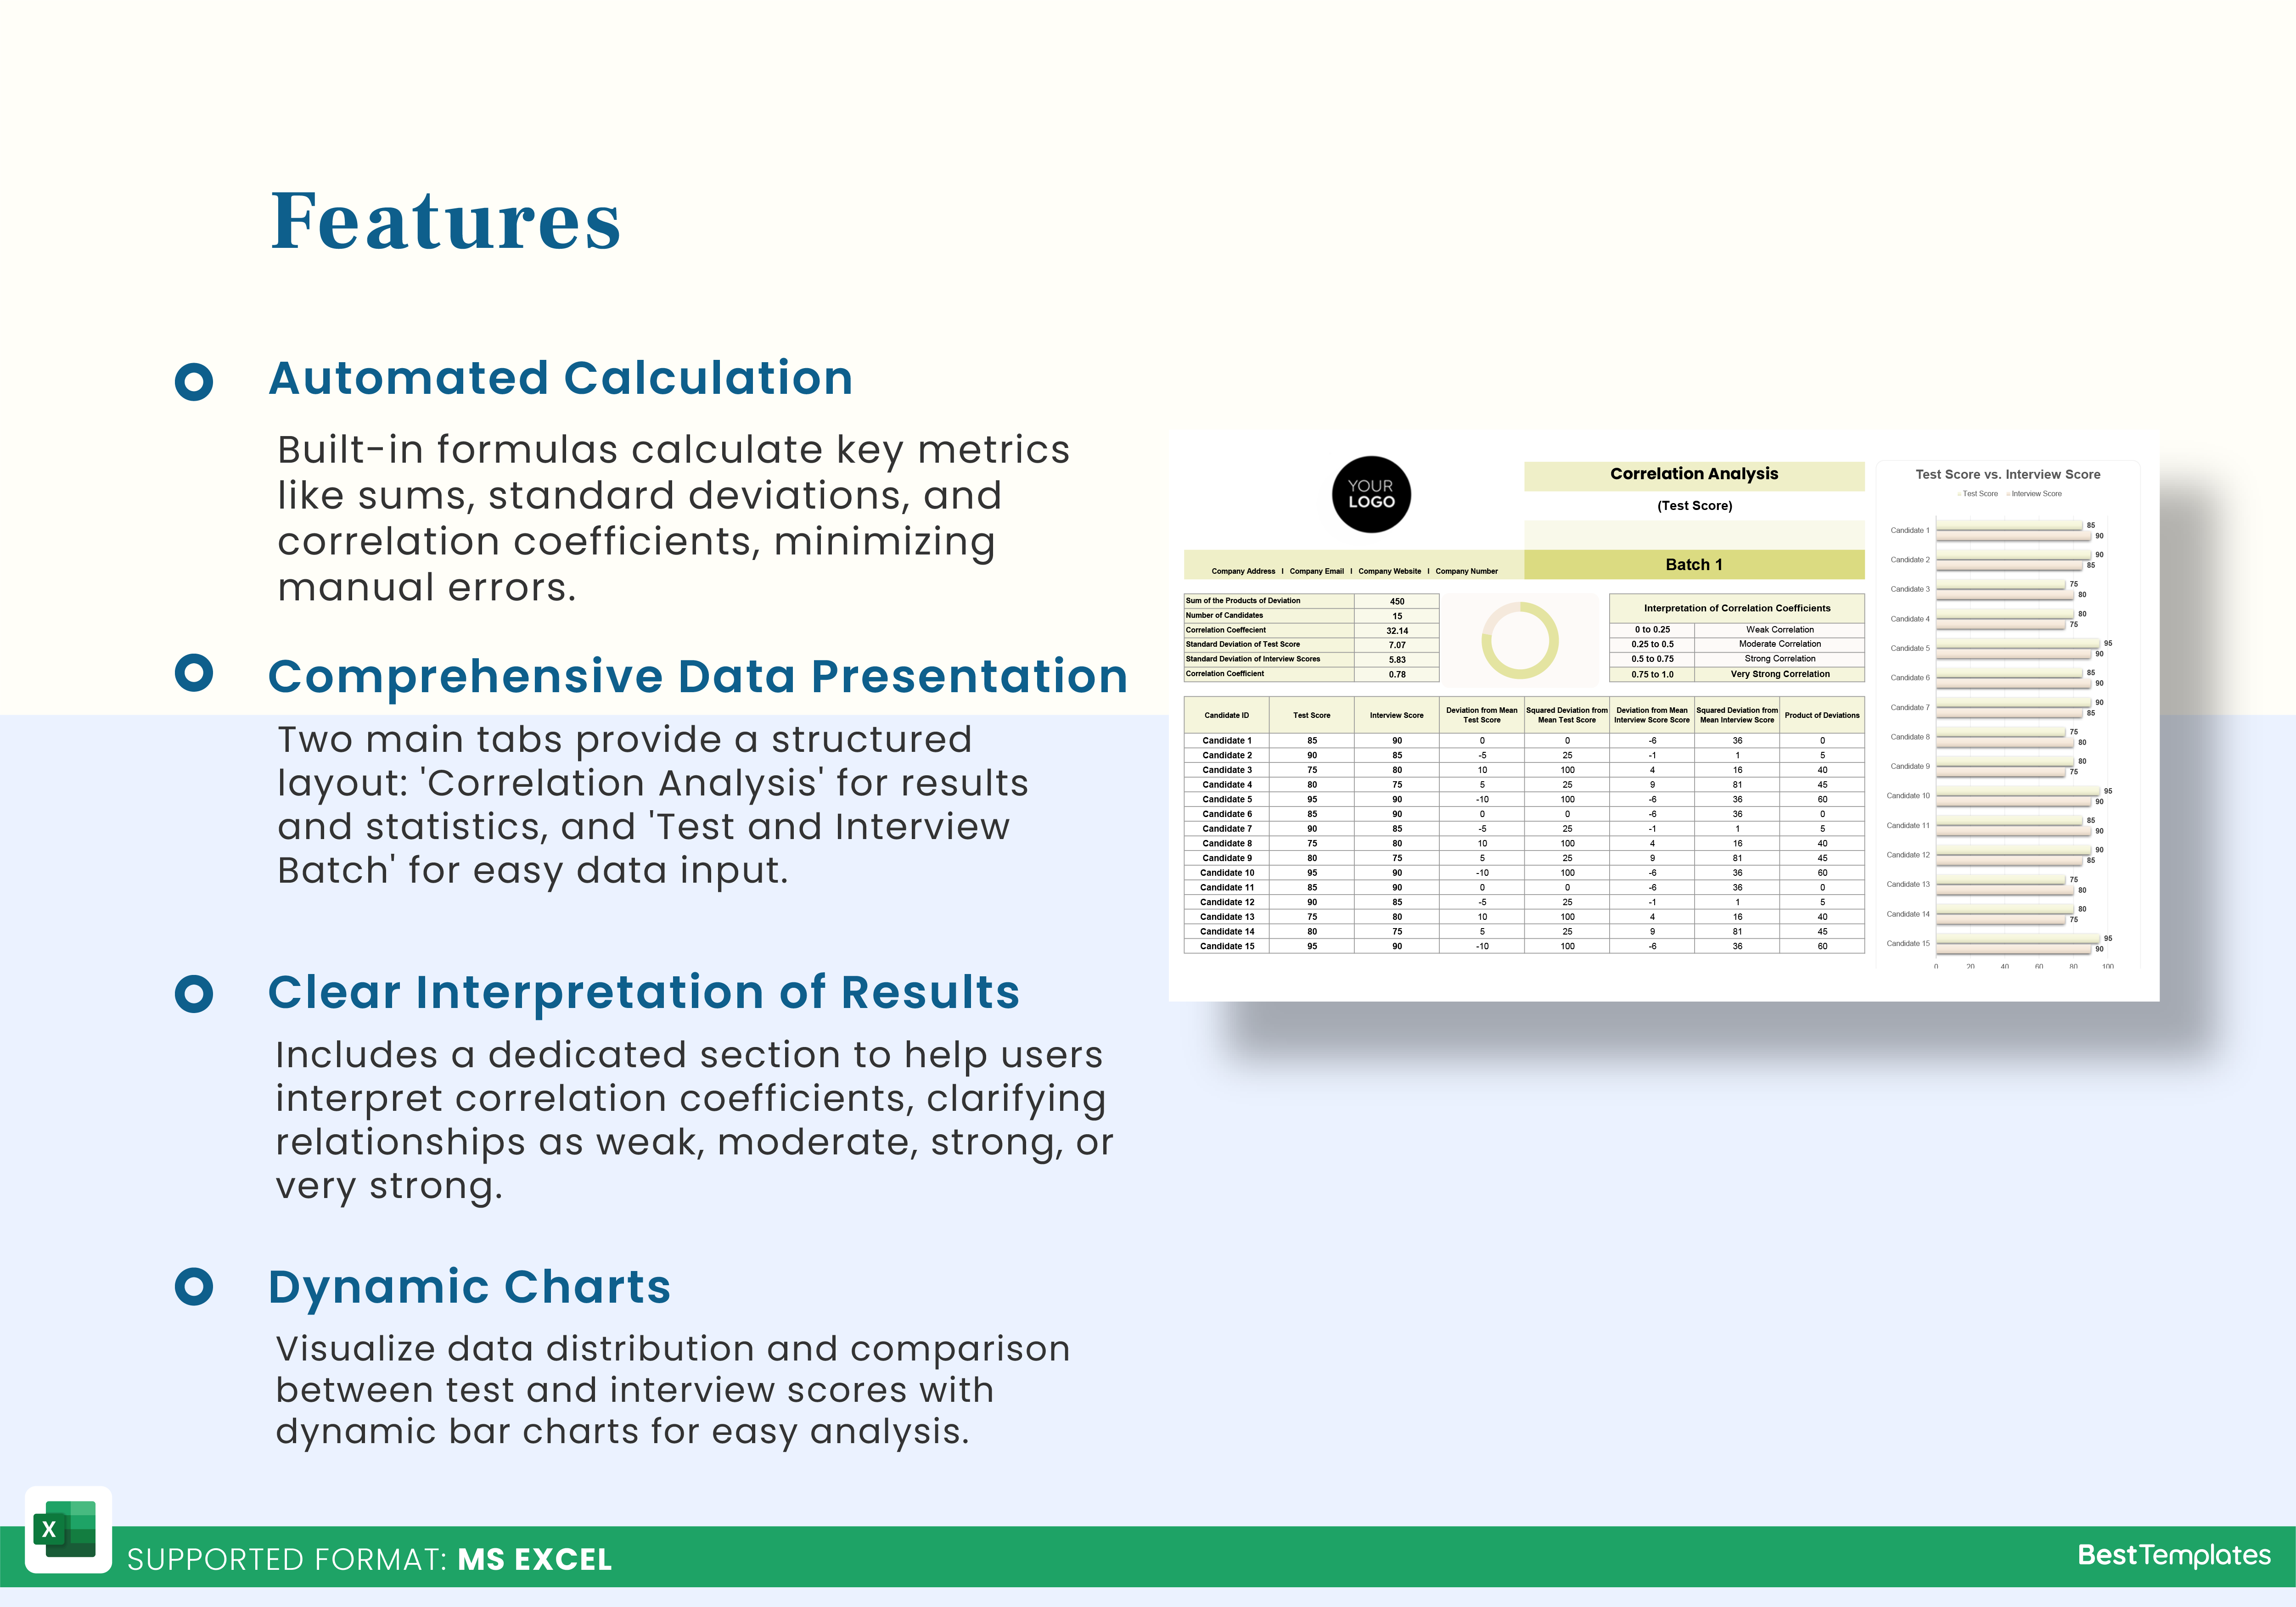
- Automated Calculations: With built-in formulas, the template calculates essential metrics such as the sum of products of deviations, standard deviations, and correlation coefficients, saving you time and reducing the risk of manual errors.
- Comprehensive Data Presentation: The template comes with two main tabs. The ‘Correlation Analysis’ tab presents the results in a well-organized manner, including key statistics and a visual representation of the correlation coefficient. The ‘Test and Interview Batch’ tab allows for easy data input, facilitating batch-wise analysis for multiple candidates or data sets.
- Clear Interpretation of Results: A dedicated section for interpreting correlation coefficients is included, helping users understand whether the relationship is weak, moderate, strong, or very strong.
- Dynamic Charts: Visual comparison between test and interview scores is made easier with dynamic bar charts, providing a clear visual of data distribution.
Perfect for business and academic environments, this template is highly customizable, with the ability to add your logo and adjust data sets. Get your copy now at Besttemplates.com to streamline your correlation analysis tasks.
Additional Information
| Available Formats | MS Excel |
|---|
Additional Product Info
- Compatibility: Excel 2021, Office 365
- Functionality: No VBA Macros or custom scripts needed
- Orientation Options: Portrait/Landscape
- Color Mode: RGB Color Space
- License Type: Standard License
- Customization: Easily editable and customizable
- Font Style: Business standard fonts are used
- Digital Optimization: Optimized for digital use only
- Printing Suitability: Suitable for printing


 No products in the cart.