Radar Chart Excel Template
$9.00
Available in stock
Already have an account? Login
Add to cart| Available Formats | MS Excel |
|---|
Description
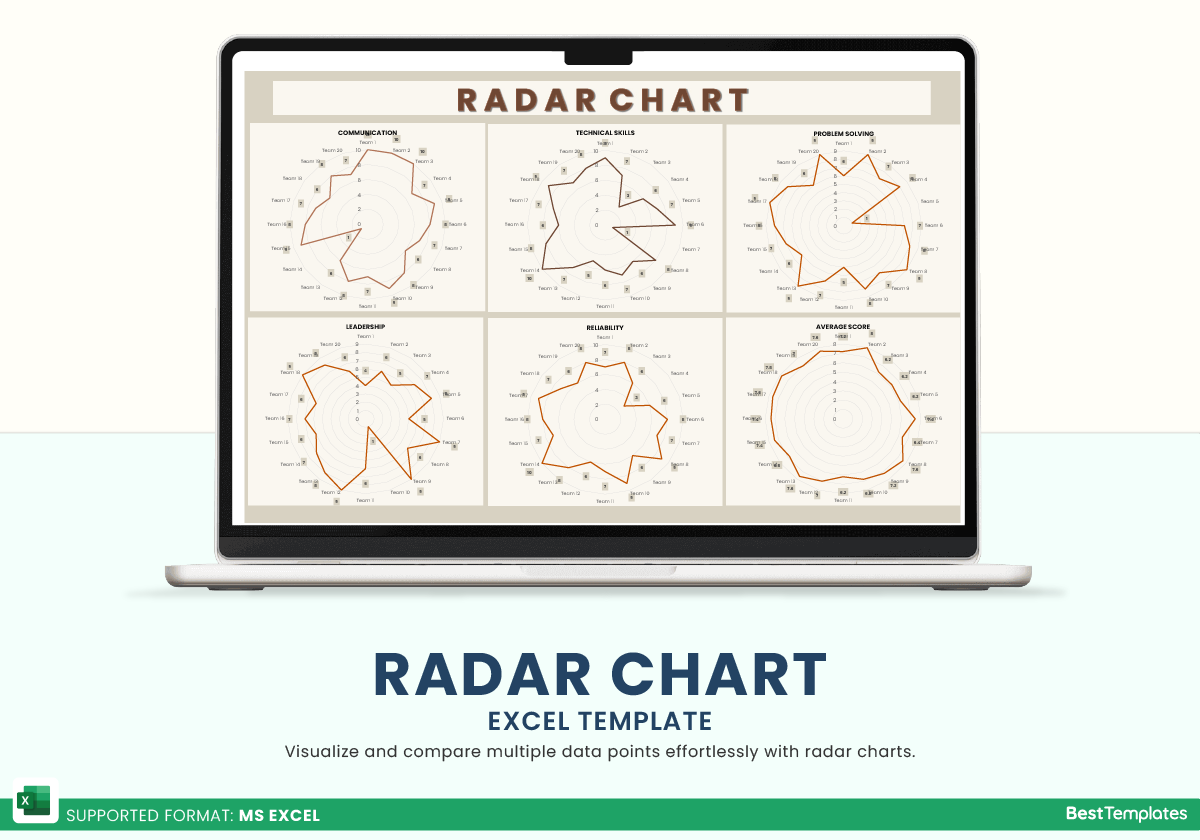
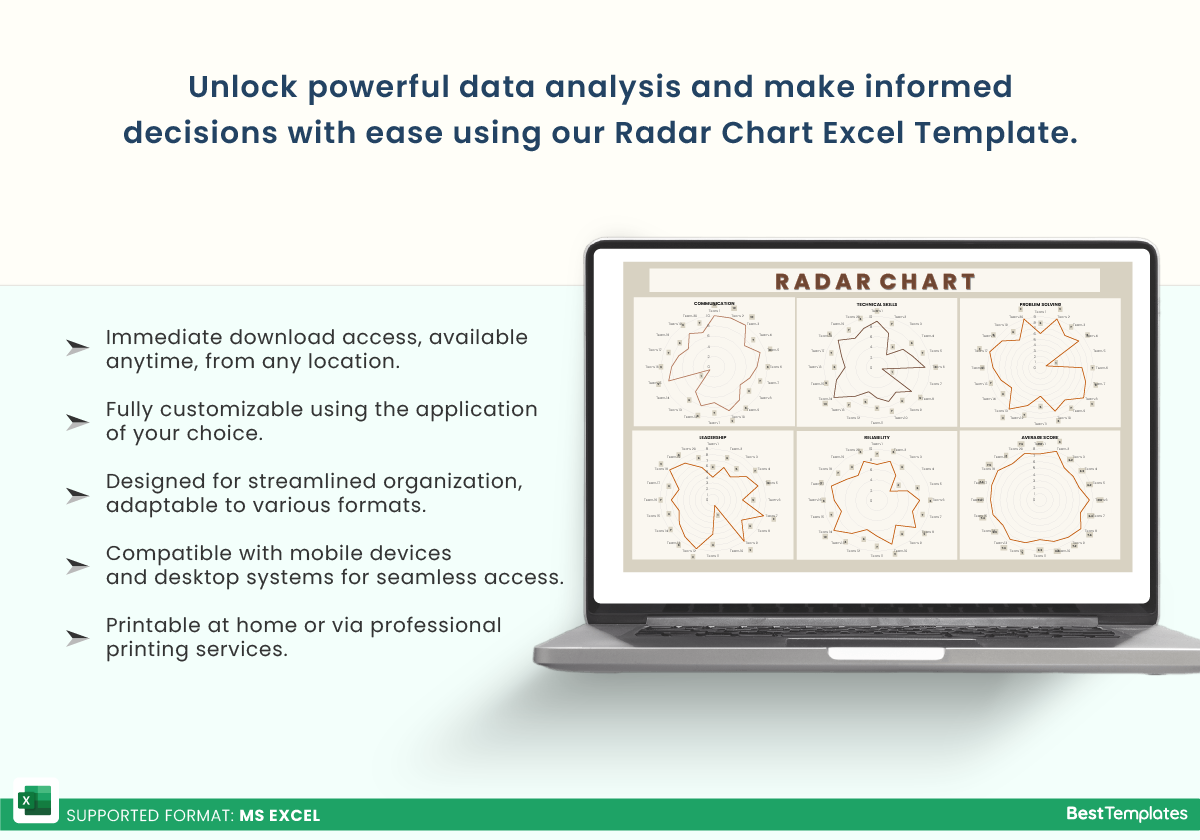
The Radar Chart Excel Template available at Besttemplates.com is a powerful tool designed to visually analyze and compare multiple variables in one easy-to-read chart. This template is ideal for businesses, project managers, and data analysts who need to make informed decisions based on comprehensive data analysis. By using a radar chart, users can visualize trends, patterns, and relationships between different variables, making it easier to identify strengths and weaknesses. The template offers a seamless user experience with automated charts and tables that update in real-time, ensuring your analysis is always up to date with minimal effort.
Key Features:
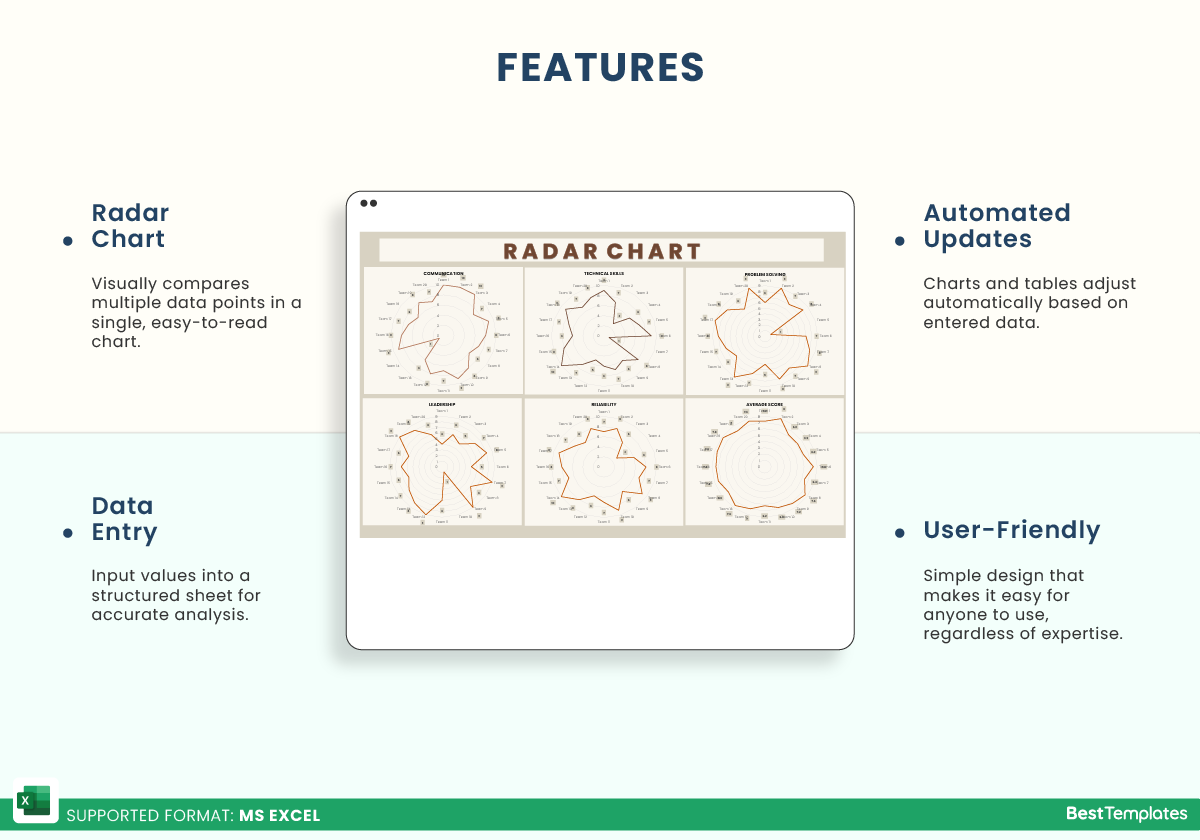
- Radar Chart: The template includes an automated radar chart that visually displays the comparison between different data points, making complex data easier to understand.
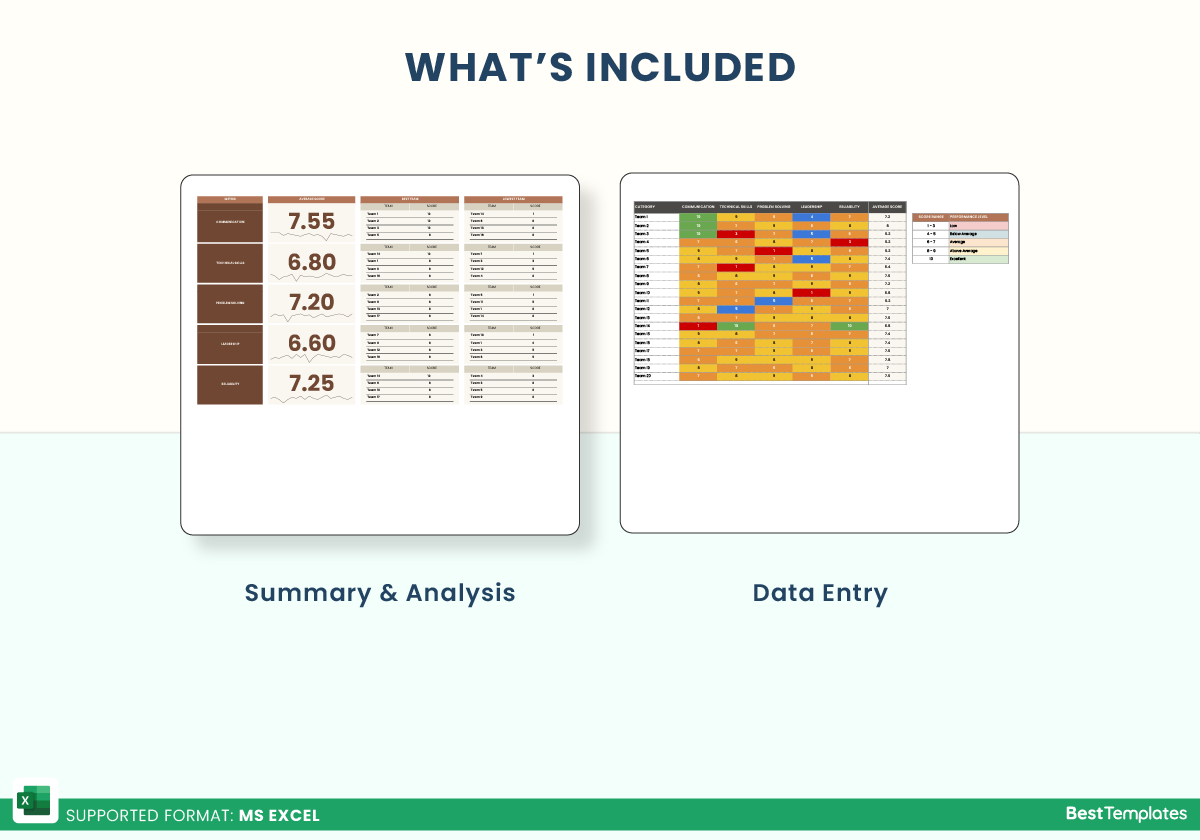
- Summary & Analysis: Automated summary and analysis tables that dynamically adjust based on the data entered in the “Data Entry” sheet, providing clear insights.
- Data Entry: A simple and structured data entry sheet where you can input your values. The average column is automated for efficiency and accuracy, making the process faster.
- Automated Updates: The charts and tables in the “Radar Chart” and “Summary & Analysis” tabs update automatically as you input data in the “Data Entry” sheet.
- User-Friendly: The template is designed with simplicity in mind, making it easy for users with any level of expertise to input data and generate insightful charts.
This Radar Chart Excel Template is a must-have for professionals who need to present complex data in a clear and visually appealing format. It’s ideal for performance evaluations, project tracking, and competitive analysis. With its automated features, you’ll save time and ensure accuracy, allowing you to focus on what matters most—making data-driven decisions.
Additional Information
| Available Formats | MS Excel |
|---|
Additional Product Info
- Compatibility: Excel 2013, 2016, 2019, 2021, Office 365
- Functionality: No VBA Macros or custom scripts needed
- Orientation Options: Portrait/Landscape
- Color Mode: RGB Color Space
- License Type: Standard License
- Customization: Easily editable and customizable
- Font Style: Business standard fonts are used
- Digital Optimization: Optimized for digital use only
- Printing Suitability: Suitable for printing


 No products in the cart.